
In this tutorial we will cover our MTF Mean Reversion Indicator, how to use it, how to customize it and how to setup alerts in Trading View and how to set up automated trading bots in 3Commas.
Note that there are video tutorials on our YouTube channel to help you learn and you can always ask questions in our Telegram Community.
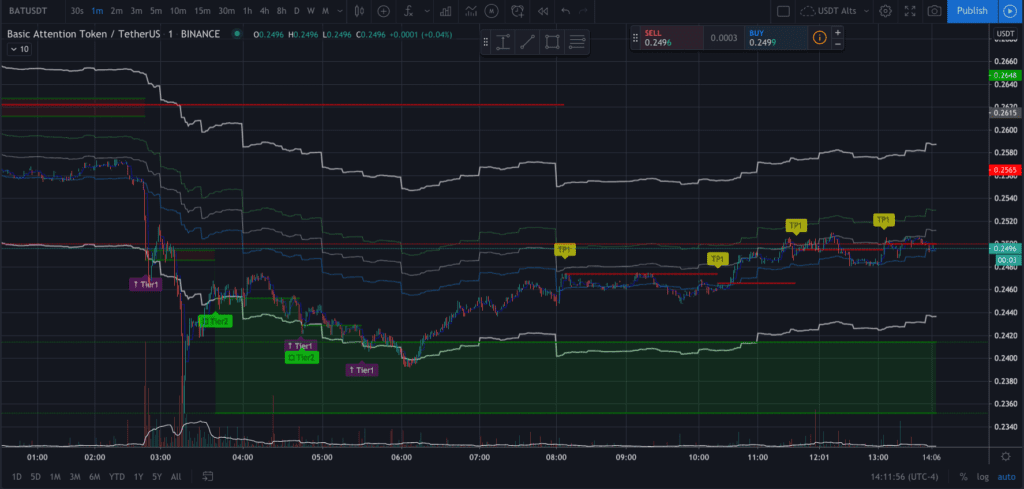
Our MTF Mean Reversion Indicators (MTF) is an algorithmic multi-timeframe indicator. Designed to identify buy zones and help you turn capital quickly, MTF may be used as a screener or assigned to automated trading bots. It identifies buying ranges with a historically and mathematically high probability of profitability in a relatively short amount of time. It was created to identify opportunities in volatile markets, but through years of testing and experimentation we discovered that it may be used in a number of ways to help traders maximize opportunities with an array of asset classes under multiple market conditions. In simple terms, the MTF Indicator is based on how much the price from lower time frames deviates from the price of overall time frame consensus, which is represented as the black line in the middle of the chart.
What is Mean Reversion?
Mean reversion is the assumption that an asset’s high and low prices are temporary and tend to revert back to the average price over time.
The MTF Indicator is a mean reversion indicator that triggers tiered buy (Long) alerts when price crosses down through the lower level of the fibonacci range identified when the MTF Indicator is overlaid on the chart. Imagine if price is a spring that wants to go back to the middle if you pull too much on it. Like a spring, price has a tendency to want to return to the middle line. Profits are realized when the price springs back towards the centerline. While price tends to bounce back to centerline in due time, there are no guarantees that it will do so without some drawdown, if at all. To the contrary, price can and sometimes does bounce beyond the centerline towards even greater profits. This is the basis behind the risk:reward principles of trading. If you aren’t familiar with these principles, we strongly encourage you to learn before you initiate a trade.
Ways to Use the MTF Indicator
While we are always experimenting with new ways to leverage the power of the MTF indicator, the two primary ways we have been using it are:
- As a mean reversion indicator
- When a coin breaks the bottom line at 0.000 fib, we’ve seen a propensity to bounce off of that pretty consistently. Tier Alerts (Buy, Long) are triggered when there is a solid 0.000 fib break (not just a wick) on the 1 minute candle close.
- As a screener
- MTF triggers an alert when an asset enters a potential buy zone. Set alerts for all coin pairs or select assets and cherry pick the ones that meet your criteria
- Automated Trading
- Bots MTF alerts can send signals to your algo trading bot for automated algo trading
- Groove Trading
- The fib levels identified as channels on the overlaid Fibonacci chart (visible on the 1min up to 15min time frame) make it easy to identify when an asset is ranging in a groove. When this action is consistent and provides a profit above say 1.25% (or any range you choose) on each bounce in a groove. Groove Traders can use MTF to scalp in a sideways market.
The default settings for MTF have been optimized for signaling potential buy zones on cryptocurrencies on the Binance Exchange, however MTF may be adjusted and optimized to be used on various assets on other exchanges and on other markets like stocks and forex. Customizing the deviation and the appearance of the MTF indicator is easy and intuitive. More on that in a moment.
Features
Embedded in a self-adjusting and periodically shifting Fibonacci chart, MTF Signals are triggered on the 1 minute timeframe. For charting purposes they also appear on the 3 minute chart. TradingView limits the historical range of time the MTF signals will appear on the chart.
Manually adjust the MTF Deviation setting to 3% for USDT pairs on Binance. This setting is called MTF HF (High Frequency) and has been nicknamed “Bradbots”.
Features:
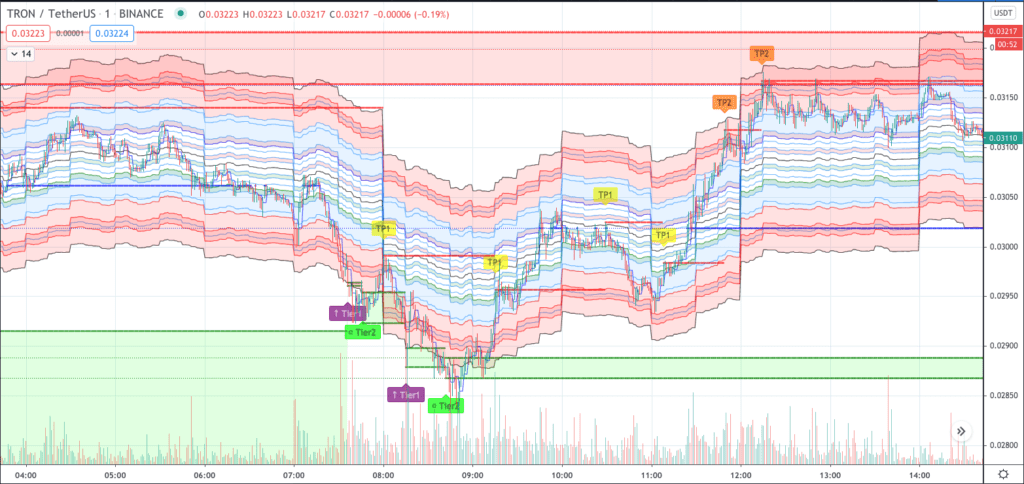
- Tier 1 (purple) and Tier 2 (green) alerts are buy signals (LONG). Sometimes an asset will trigger 1 single alert, other times there may be clusters of multiple alerts. When Tier alerts are off color (red or dark green) it is an indication of instability such as pumps, dumps, or other perceived anomalies.
- Lag time between signal, Trading View, bot activation and exchange may affect “market price” of executed orders.
- The first alert in any cluster is a Tier 1 Alert which occurs when price crosses down below “0 Fib” on the MTF overlayed Fibonacci chart.
- Alerts are painted on the 1 minute candle close and signals are sent when the adjacent candle opens.
- Secondary alerts are triggered when price either crosses back below “0 Fib” or price simply re-enters the “buy zone” where prior alerts fired nearby.
- Secondary alerts may be Tier 1 or Tier 2.
- Possible re-entries are easily identified with neon yellow/green candles that fall in the range of near term Tier 1 and Tier 2 signals
- TP1, TP2, TP3 Alerts are split take profit (TP) levels.
- We do not recommend using TP1 or TP2 signals to automate profit taking at this time. They are often reliable, however due to periodic chart shifts they can sometimes occur in less than optimal price ranges including below your base entry price. You could lose money if you use these to close trades.
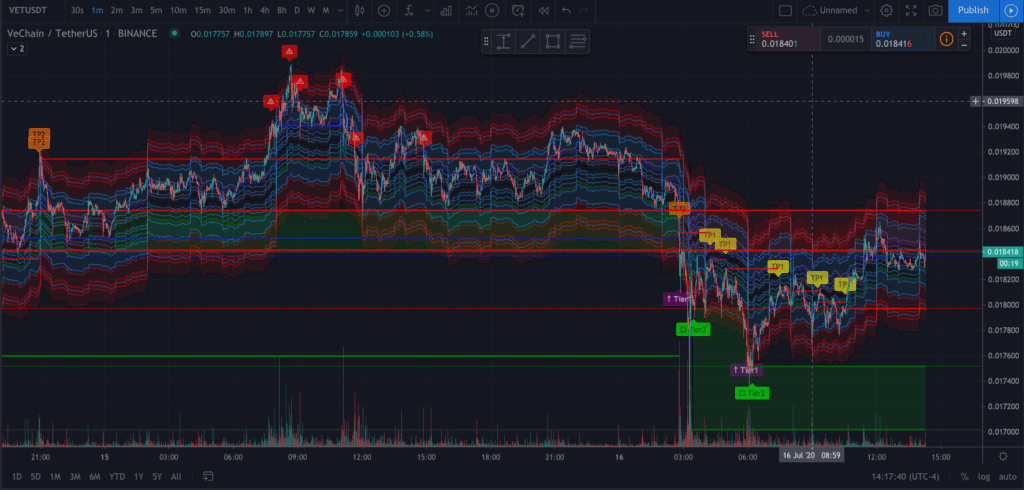
- TP3 Alerts are accompanied by a poop emoji to signal a high probability of a price dump.
- TP3s have historically been a consistent indicator of near term peak price and can be predictive of an upcoming dump.* Still though, we recommend using specific profit target values rather than automating profit taking on the signals.
- Pump/Dump alerts
- These red, warning signs are easy to spot on the chart and indicate a high probability that a large move is about to happen.
- Alert level horizontal lines
- Green lines indicate near term support relative to Tier 1 and Tier 2 Alerts
- Red lines indicate near term resistance relative to TP signals
- Blue lines indicate various levels of profit markers relative to adjacent Tier alerts.
- Green shaded areas identify a range where Tier alerts triggered in the near term.
How to add and adjust the MTF indicator in TradingView
To use the MTF Indicator, you will need a TradingView account.
- Open the pair that you want to use for the indicator in TradingView
- Click on the add indicator button on the top of the screen
- When the dialog box for indicators opens, choose Invite-only scripts on the left side.
- On the right you will see several indicators to choose from. To add MTF, choose MTF Deviation (on-chart) from the list
- After the chart has loaded with MTF Deviation, set the chart to 1 minute candles.
Customizing the MTF Indicator
Adjusting The Deviation Setting
You will now want to adjust the deviation setting to your liking. The default setting for MTF Deviation on the indicator is 6%. Many Material Indicator traders are using a 3% deviation for USDT pairs and a 6% deviation for BTC pairs. Those settings have been optimized for conditions at the time of this writing for cryptocurrency pairs on Binance. They may be adjusted and optimized for various assets, asset classes and market conditions. You should review the chart and decide what setting is best for your trading preferences and strategies. To adjust the deviation setting and other settings for the indicator like what to show or not show, navigate to the indicator’s settings module and do the following:
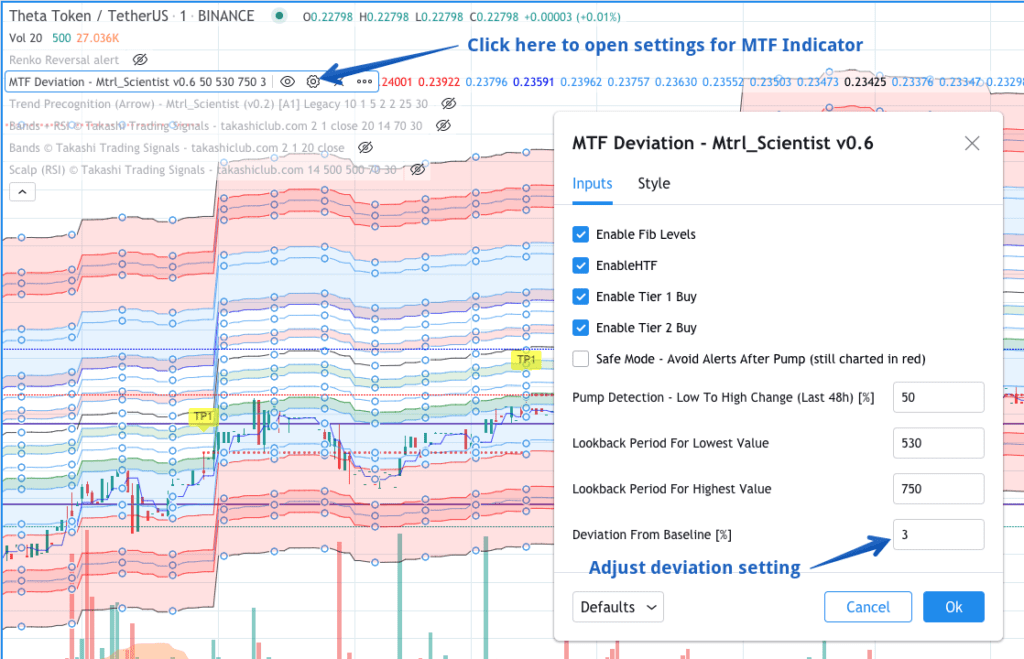
- Click on the settings icon in the list of enabled indicators (see screenshot above)
- In the box on the bottom right hand side of the screen labeled Deviation From Baseline, change the deviation setting to the number you want.
- Click OK and the chart will adjust to your settings.
Changing the Appearance of the Chart
The channels make it easy to identify assets trading in a groove or channel. Traders who prefer acleaner chart can change colors and remove channels without affecting the performance of the indicator.
To customize how the indicator looks on your chart, load the indicator , then double click until the settings module opens, or simply click on the gear icon to edit; then click the Style tab.
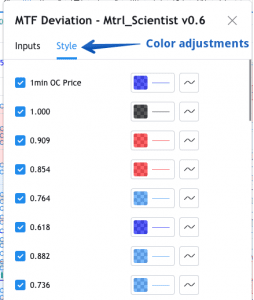
You may change colors or remove as many of the lines and fill shading as you like to make the chart appear the way you like with no effect on performance.
It is recommended that you leave at least the 1.0, 0.5 and 0.0 lines to help gauge price movement, however removing those lines will not impact performance.
Setting MTF Alerts in TradingView
Alerts allow you to be notified when an MTF condition has been met by one of the pairs you are monitoring. Trading View limits the number of active alerts you can have based on your subscription level. Before you spend time setting alerts, verify how many you are permitted and choose accordingly. Between BTC and USDT there are likely more MTF combined Tier 1 and Tier alerts than you account can accommodate. Best to do your research on assets that meet your criteria and filter out the ones you don’t. As a point of reference, as of 7/19/2020 more than 60% of MTF signals are Tier 1 and less than 40% have been Tier 2.
To set an alert:
- Open a TradingView chart for the coin pair for
which you want to set the alert for and add the MTF Indicator to the chart - For BTC pairs the default setting is 6% deviation. For USDT pairs you must adjust the deviation to 3%. See instructions above for changing the deviation settings.
- Make sure the chart is set to the 1 minute time frame.
- Click on the Alert button above the chart.
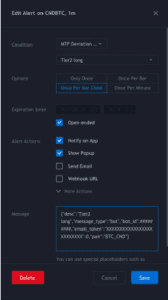
- In the top dropdown, choose MTF Deviation
- In the second dropdown, choose which of the two Tier alerts you want for an alert – Tier 1 or Tier 2.
- Historically, Tier 1 alerts have occurred more frequently than Tier 2 alerts
- In the options box, choose when you want the alert to fire. Most users typically choose Once Per Bar Close, because sometimes a signal may paint before it is actually ready to be permanent.
- The Alert Actions area is where you will tell the system how you want to be notified of an alert and if you want to connect the alert to an automated trade on a bot platform like 3commas. We cover how to setup 3commas bots in a separate document.
- Message Settings:
- For manual alerts you may type your own description here so you know what the alert is when the notification is sent.
- If you are automating your trades, this is where you will insert your bot commands. In the case of a 3Commas bot, to start a deal you would want to copy and paste the “Message for deal start signal” for a Tier1 or Tier 2 alert which includes the unique Bot ID associated with that particular bot. For more, see our separate documentation for 3commas bot setups.
*Material Indicators LLC is not a financial advisor and does not provide financial advice of any kind. Nothing on any of Material Indicators’ websites, apps, indicators or channels should be considered trading advice. By using Material Indicators’ tools, indicators and resources you agree to take responsibility for your own trades and acknowledge that Material indicators LLC does not guarantee performance and assumes no liability for your results. Trading is risky. Consult a licensed financial advisor, do your research and never risk more than you can afford to lose. Past performance does not guarantee future results.
Got Questions?
Visit our FAQs and Tutorials or ask our Telegram Community. We engage there daily.