Fire Charts Order Book & Order Flow Data
Replace Speculative Decisions with Data Driven Decisions
Fire Charts are data visualization tools that empower you to replace speculative decisions with data based decisions by providing a high resolution view of order book and order flow data (CVD) on BTC and USDT pairs. Color scaling lets you visually identify precise levels of resistance, support and liquidity on the Fire Charts heat map, and our proprietary CVD chart shows you exactly when whales are making market orders that impact price action.
Get Early Access to Our Newest Version of FireCharts
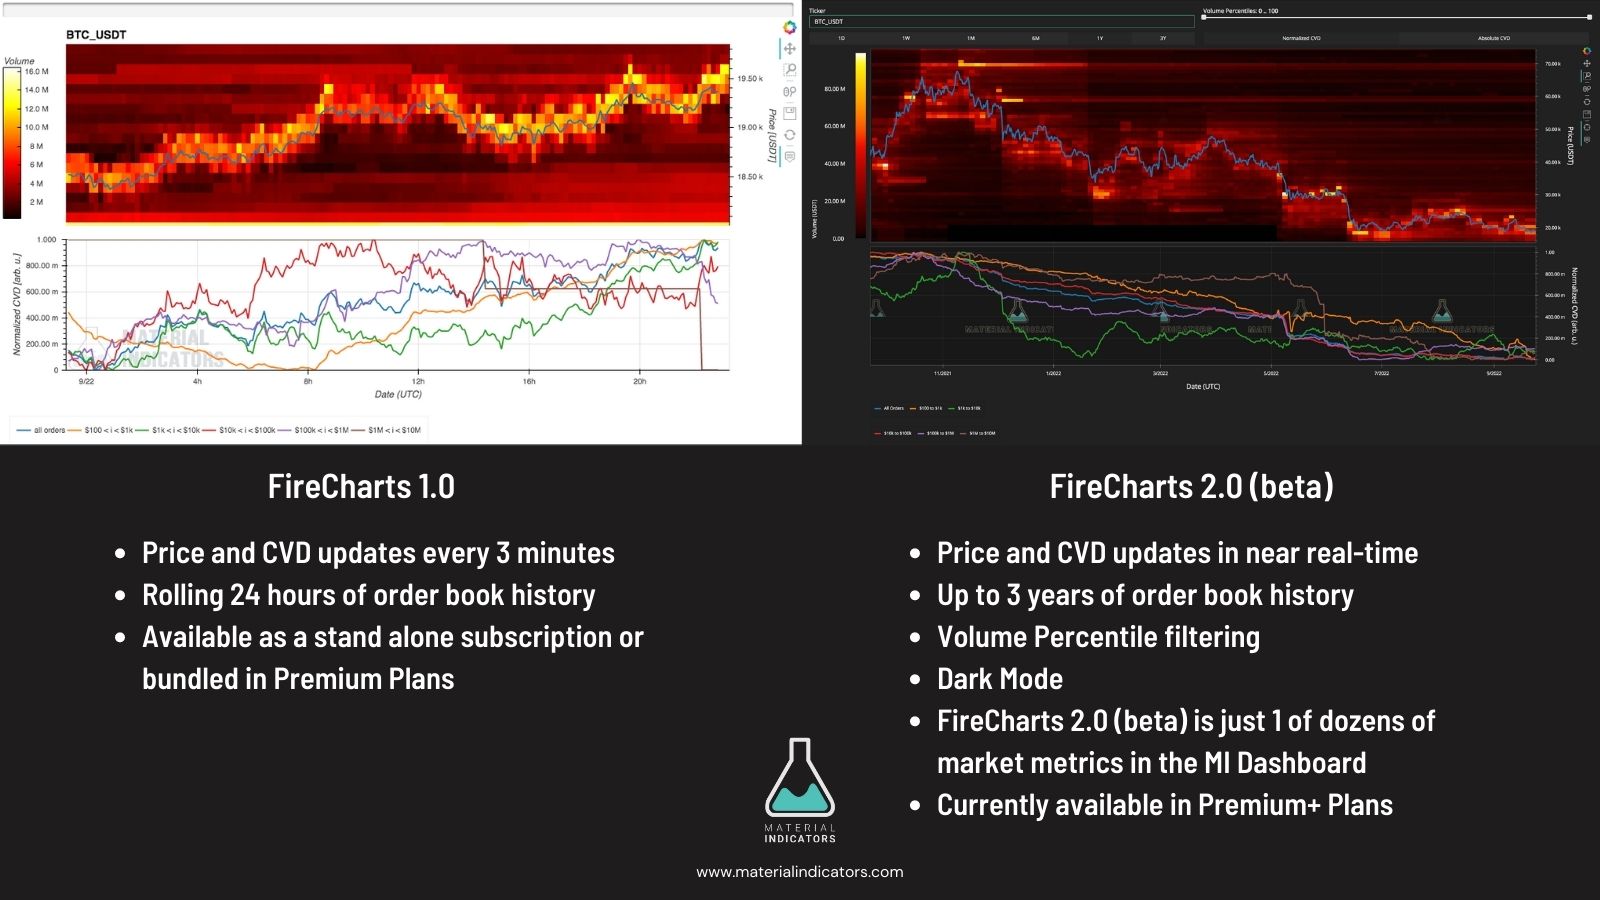
We are constantly looking for ways to improve the data we deliver and the ways we deliver it. FireCharts currently supports order book and order flow data on all Spot BTC and USDT crypto coin pairs on Binance. It is an invaluable data visualization tool that has helps traders identify opportunities and mitigate risk. Our newest version, FireCharts 2.0 (beta) incorporates a long list of upgrades and is included with dozens of other charts and institutional grade crypto market metrics in the MI Dashboard.
Compare FireCharts v1.0 and v2.0 (beta) and get the plan that's right for you.
Order Book Heat Maps
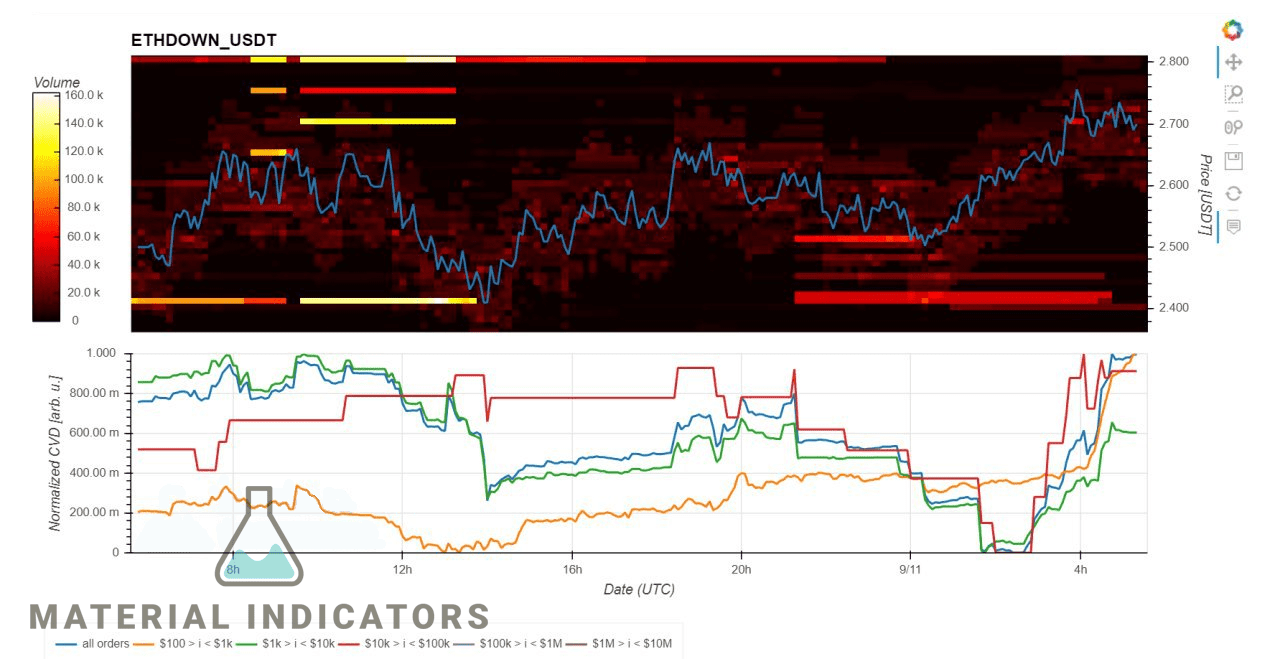
Fire Charts are thermal heat maps of the order book that allow you to call up BTC and USDT coin pairs and see a visual representation of resistance, support and liquidity as it sits in the order book.
Color scaling tells you the density of the trading volume. Zoom and price data tools make it easy to identify targets with laser precision, making Fire Charts a premium data visualization tool that helps you identify opportunities and mitigate risk.
Order Flow CVD Charts
Our CVD (Cumulative Volume Delta) indicator takes order flow data visualization to another level. Our proprietary, binned CVD chart gives a visual representation of order flow, illustrating when whales, sharks and retail traders are making market orders that impact price action. Let’s face it, we don’t all have the money to be whales, but this powerful tool makes it easy to swim with them.
A Powerful Trading System
Many members of our Telegram trading community use Fire Charts to help validate signals they’ve received and also to identify trading opportunities that may not necessarily be associated with a specific signal. Using Fire Charts order book and order flow data visualization tools to identify opportunities, validate setups and mitigate risk empowers you to replace speculative trading decisions with data driven decisions. See samples of Fire Charts and discussions around them flowing in our Telegram channel.
FireCharts Tutorials
Intro to FireCharts
How to Use Order Book and Order Flow (CVD) Data to Validate Setups and Mitigate Risk
Understanding Binned CVD in FireCharts
How to Interpret Moves and Trends with Order Flow Data (CVD) in the FireCharts Web App
Using FireCharts In Different Time Frames
Understanding Scaling and Liquidty Binning of Historical Order Book Data in Different TimeFrames
To see the full library of tutorials and get updated when new videos are released, subscribe to our YouTube Channel here.
Subscribe to our newsletter
Get news, updates, and offers from Material Indicators
Thank you!
You have successfully joined our subscriber list.