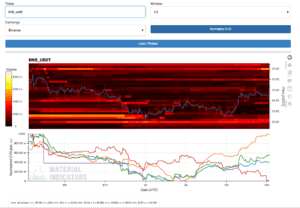

Identify support, resistance and liquidity in the order book, on-demand, with static 2 Week FireCharts posted in your channel every 2 hours.
NOTE: This product is not currently available to retail customers.
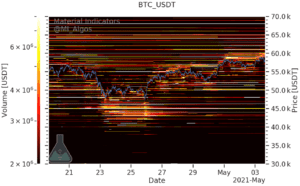
Identify support, resistance and liquidity in the order book, on-demand, with static 2 Week FireCharts posted in your channel every 2 hours.
NOTE: This product is not currently available to retail customers.